Device Telemetries
The Telemetries tab on the device detail brings together everything a device reports about itself into a single screen. You can see the current state of a device next to its recent history, which makes it easier to spot gradual degradation or overheating before it causes downtime, troubleshoot a misbehaving device faster, and decide when hardware needs replacing.
deviceManagement · Plan: Basic Device Plan or higherOpening the tab
Open a device detail and select the Telemetries tab. You can also click any of the metrics in the device detail header — CPU, memory, temperature, storage and the others link straight to this tab.
What a card shows
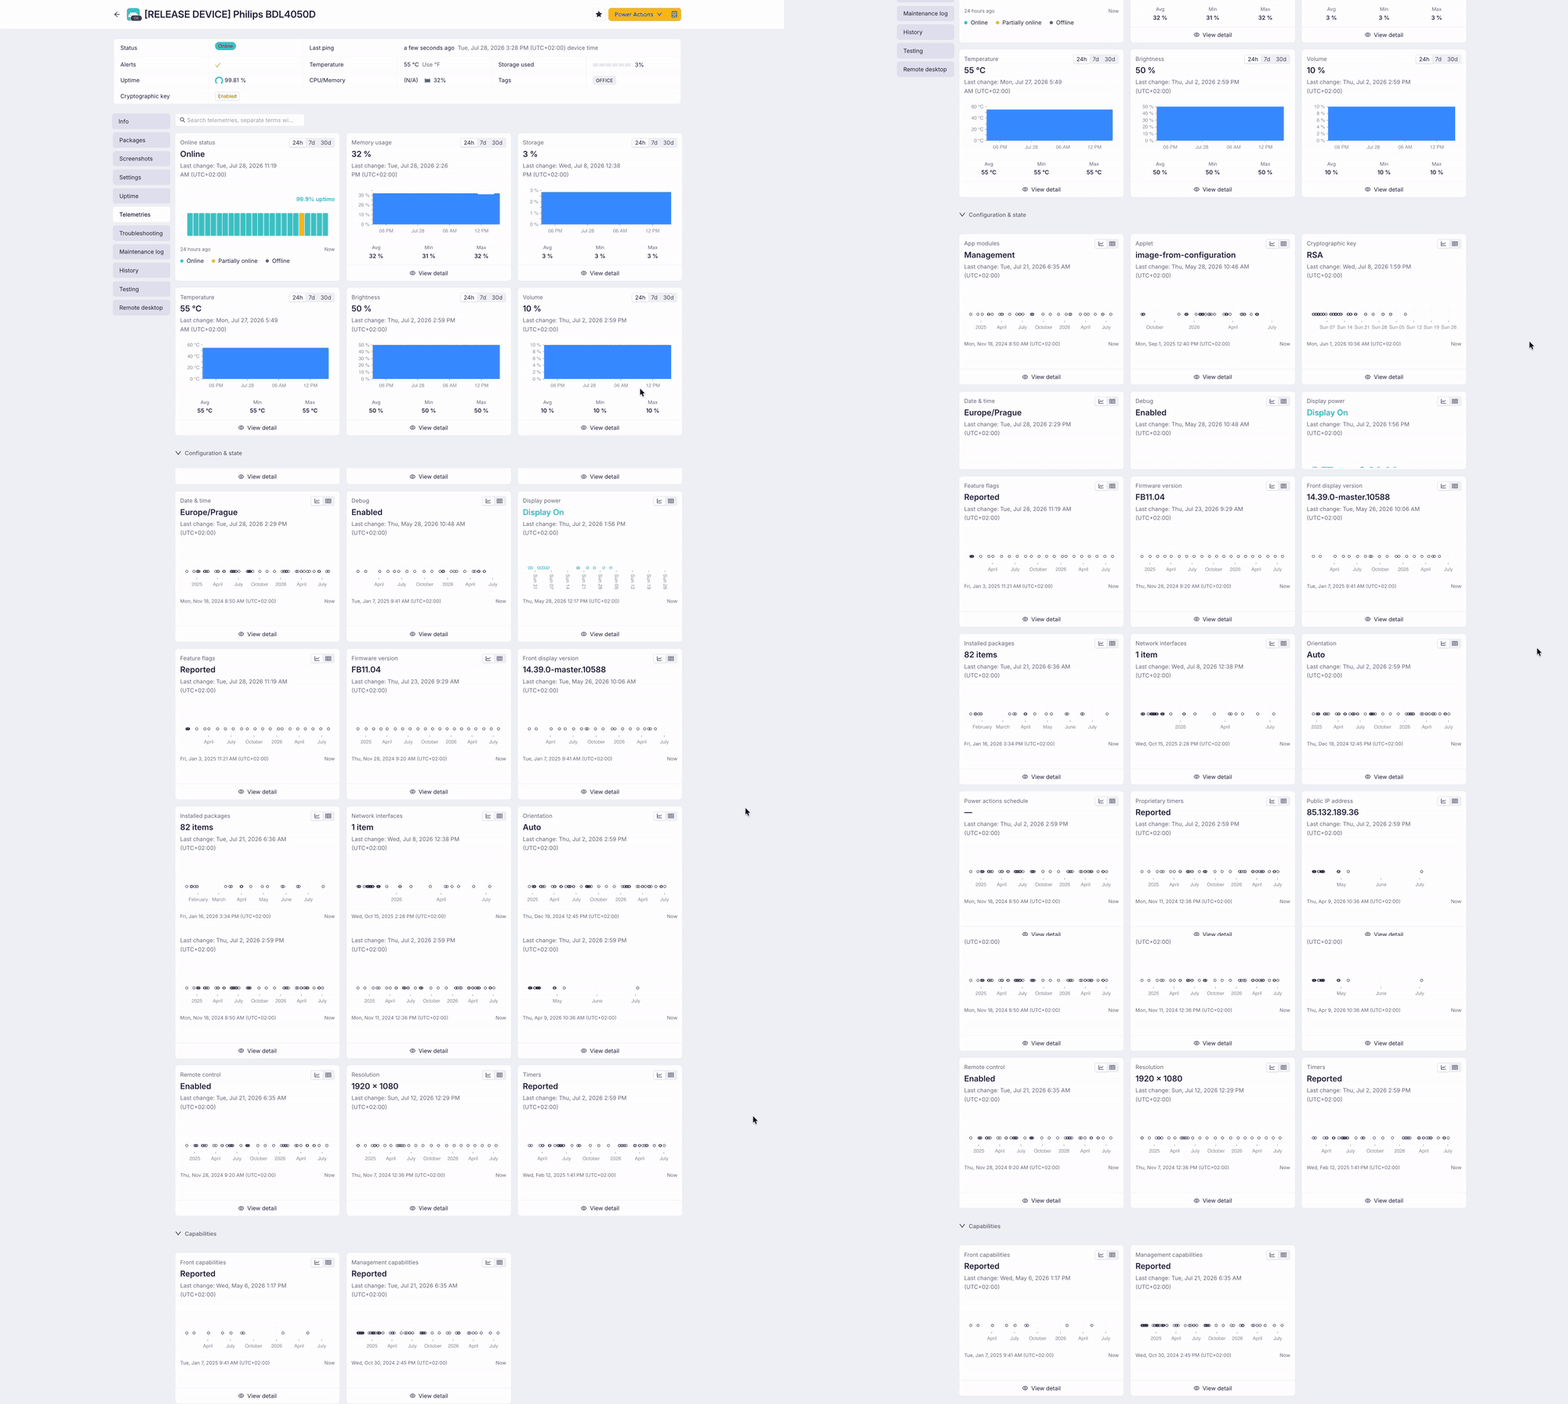
The tab displays one card per telemetry. Every card shows:
- the latest reported value
- when it last changed, in the device's own timezone, so it matches what happened on site
- the history of the value
Numeric values that change gradually — CPU usage, memory usage, storage, temperature, brightness, volume and Wi-Fi signal strength — are drawn as a graph. You can switch the range between 24 hours, 7 days and 30 days, and each graph shows the average, minimum and maximum for the selected range. Temperature follows the Celsius/Fahrenheit setting you have chosen in Box.
Values that only change occasionally — resolution, orientation, remote control, firmware version and similar — show a timeline of recent changes instead of a graph. You can switch each of these cards between a graph of when the changes happened and a table of the individual values.
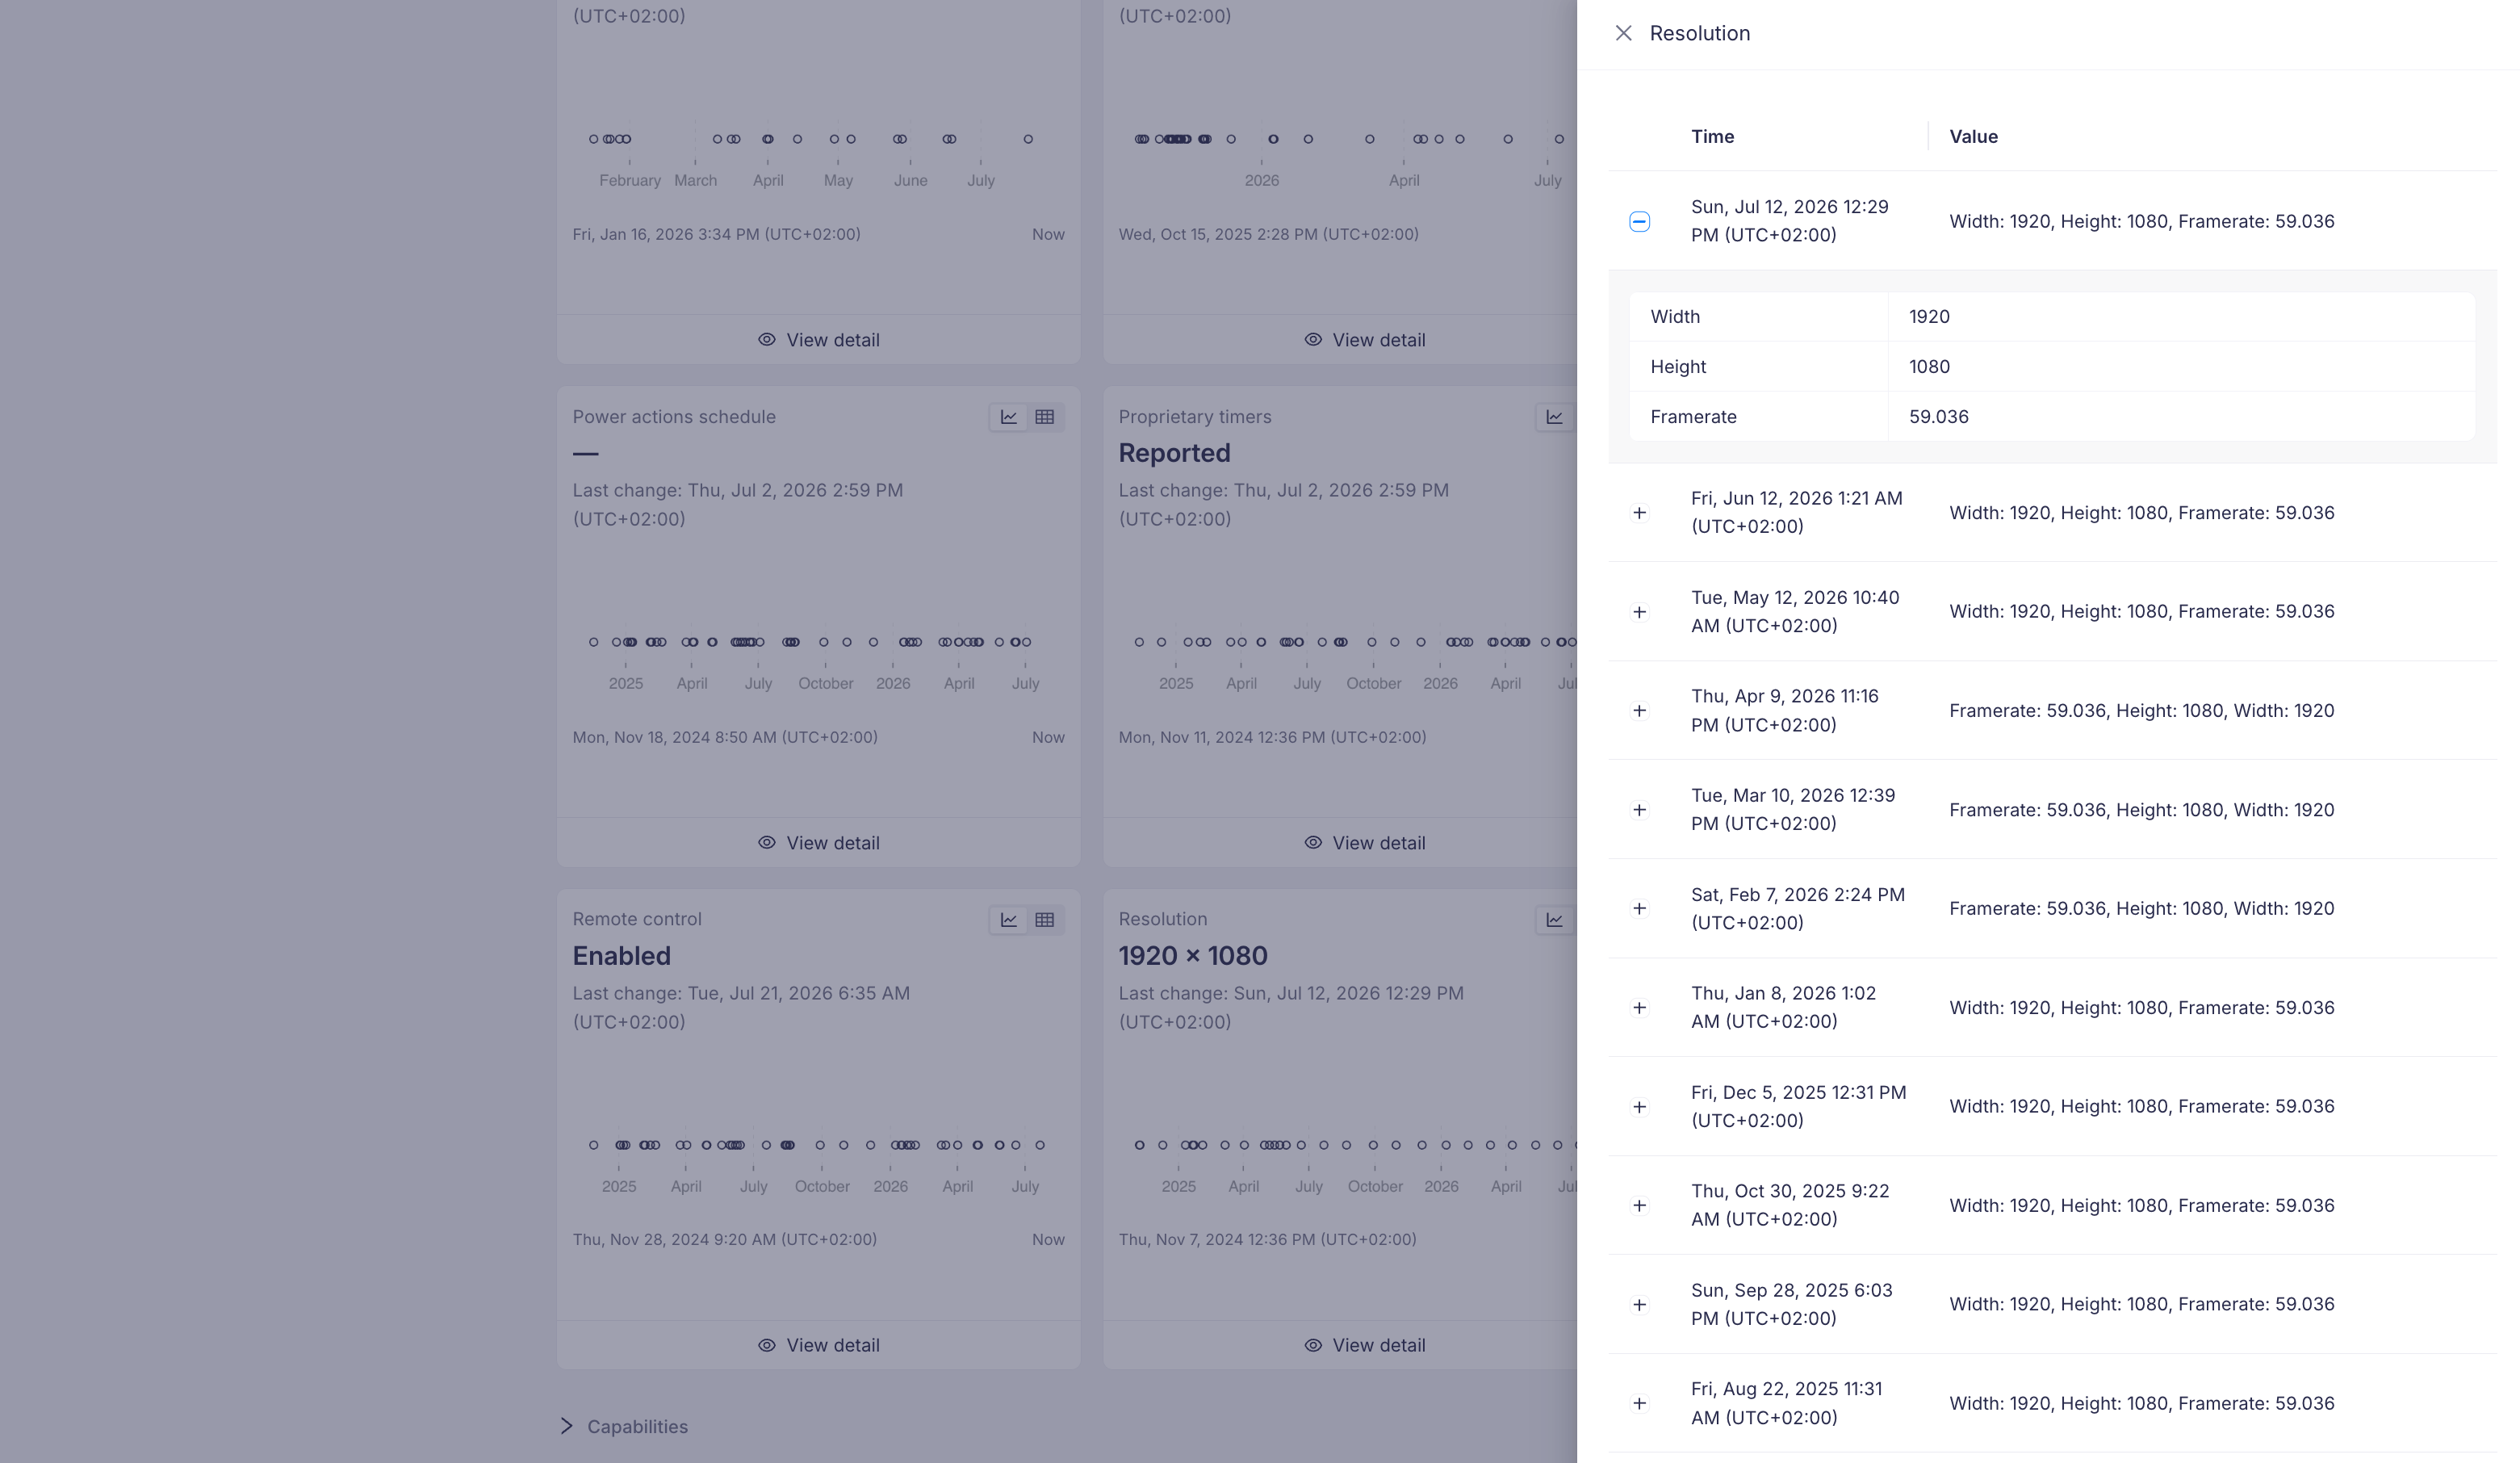
View detail at the bottom of a card opens the full change history, with the time of every change and its value. Expanding a row shows the complete values that were reported at that moment.
Sections
The metric cards are displayed right away, below the search field, always in this order:
- Online status
- CPU usage
- Memory usage
- Storage
- Temperature
- Brightness
- Volume
- Wi-Fi signal strength
Everything after them — Plugins, Runners, Configuration & state and Capabilities — is collapsed. Click a section name to expand it.
Plugins and Runners
Next come Plugins, Runners and Runner (custom telemetry), if the device runs any, with one card per instance and the custom data that instance reports.
| Section | Plan required |
|---|---|
| Plugins | 👑 Pro Device Plan or higher |
| Runners | 👑 Pro Device Plan or higher |
Configuration & state
Everything else the device reports about its setup — network and connection, applet, application and firmware versions, display and screen settings, recovery options, remote control, date and time, timers and feature flags. Cards in this section are sorted alphabetically.
Capabilities
The last section lists what the device supports. This is a reference list rather than a measurement — useful when you need to check whether a device can do something you are trying to set up.
Searching
The search field filters cards by name and accepts several terms separated by commas — for example cpu, temperature, storage shows all three at once. While searching, the sections are set aside and all matching cards are listed together alphabetically.
Why a card may be missing
The tab only shows telemetries your device has actually reported, so a device that has just been added will show fewer cards than one that has been running for a while. A card can also be missing because:
- the telemetry is not part of your Device Plan
- the value does not apply to your device
- the device cannot report the value reliably. This is most common with Wi-Fi signal strength, which is hidden when the device reports no signal, when its Wi-Fi is inactive or reconnecting, or when the device cannot provide a trustworthy reading.
If your applet uses a secret configuration, its values are never displayed in the Telemetries tab.
If a device shows a value that is clearly wrong, please submit a ticket with the device UID.
How often the data updates
The Telemetries tab shows what the device reports on its configured schedule, so the level of detail depends on your telemetry interval — with a six-hour interval you will not see minute-by-minute changes. Values changed directly on the device, for example with a remote control, arrive with the next report rather than immediately. See Telemetry and data reporting frequency for the intervals you can set.
The same data is also available through the signageOS REST API if you want it in your own monitoring tools.